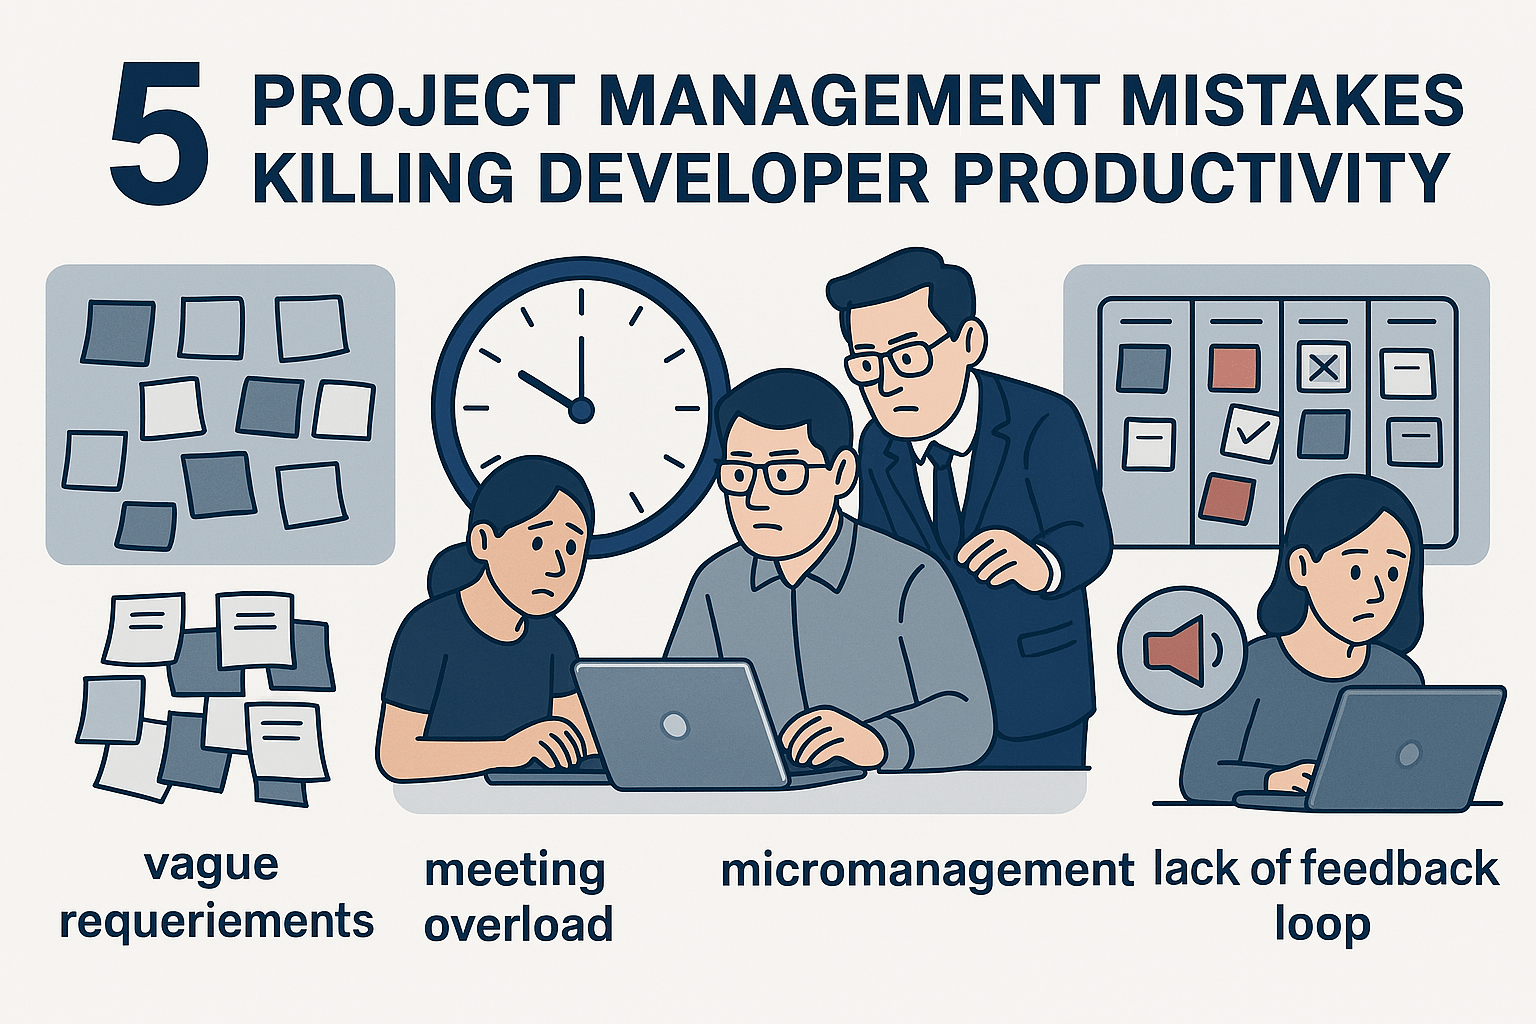
“We’ll refactor this later.” “Just hardcode it for now.” “The client needs this feature ASAP.”
Sound familiar? Every project manager has heard these phrases—and probably said them too. But what happens when “later” never comes? After years of managing development projects and witnessing the long-term consequences of these decisions, I can tell you: technical debt isn’t just a developer problem. It’s a business problem that silently bleeds money, kills productivity, and destroys team morale.
Today, I’m sharing the real costs of technical debt from a project manager’s perspective—not just the theory, but the actual dollar amounts, timeline impacts, and human costs I’ve tracked across multiple projects. drains money, undermines productivity, and erodes
What Technical Debt Really Looks Like in Practice
Before diving into costs, let’s establish what we’re talking about. Technical debt isn’t just “messy code”—it’s the accumulated effect of expedient decisions that prioritise short-term delivery over long-term maintainability.
Real Example from Paperclip Software
When I joined as Software Architect in 2013, I inherited a PHP application with classic technical debt symptoms:
The Codebase:
// Actual code snippet (anonymized)
if ($user_type == 1) {
    // Admin logic hardcoded everywhere
    $query = "SELECT * FROM users WHERE role='admin' AND status=1";
} elseif ($user_type == 2) {
    // Manager logic
    $query = "SELECT * FROM users WHERE role='manager' AND department_id=" . $dept_id;
} elseif ($user_type == 3) {
    // Employee logic
    $query = "SELECT * FROM users WHERE role='employee' AND active=1 AND verified=1";
}
// This pattern repeated across 47 different files
The “Simple” Feature Request: Business wanted to add a new user role: “Team Lead”
Expected Timeline: 2 days Actual Timeline: 3 weeks
Why? The user role logic was hardcoded across 47 files, 12 database queries, and 8 different UI components. What should have been a configuration change became a system-wide refactoring project.
The Hidden Cost Categories
1. Feature Development Slowdown
The Math:
- Original feature estimate: 2 days
- Actual time spent: 15 days
- Developer hourly rate: $10/hour (Assumption)
- Direct cost impact: $5,200 instead of $800
But this is just the beginning. Technical debt creates a compounding slowdown effect:
Velocity Degradation at For a Project (Tracked over 18 months):
Quarter 1: 12 features delivered
Quarter 2: 10 features delivered (same team, same complexity)
Quarter 3: 8 features delivered
Quarter 4: 6 features delivered

Root Cause Analysis:
- 40% more time spent understanding existing code
- 60% more time spent working around existing limitations
- 80% more time spent on integration and testing
Annual Impact: We went from delivering 48 features per year to 32 features—a 33% productivity loss worth approximately $60,000 in lost business value.
2. Bug Introduction and Maintenance Costs
Technical debt doesn’t just slow down new features—it actively creates bugs.
Case Study: E-commerce Checkout System
The original checkout flow had payment logic scattered across multiple files:
- Payment validation in the frontend
- Payment processing in three different backend files
- Payment confirmation emails in a separate service
- Payment logging in yet another module
The Cascade Effect: When we needed to add a new payment method (Stripe), the developer had to modify different files. They missed updating the logging module, which caused:
- Immediate Issues:
- Failed payments weren’t logged properly
- Customer service couldn’t track payment issues
- Accounting reconciliation became manual
- Business Impact:
- 3 hours daily of manual reconciliation
- 2 escalated customer complaints per week
- 1 accounting error that took 40 hours to resolve
- Total Cost Over 6 Months:
- Manual work: $22,500
- Customer service escalations: $3,200
- Accounting correction: $2,000
- Total: $27,700 for what should have been a $2,000 feature
3. Team Morale and Retention Costs
This is the cost most project managers miss, but it’s often the highest.
Developer Frustration Metrics I’ve Tracked:
High Technical Debt Projects:
- Average developer tenure: 18 months
- Job satisfaction score: 6/10
- Voluntary turnover: 35% annually
- Time to full productivity: 4 months

Low Technical Debt Projects:
- Average developer tenure: 3.2 years
- Job satisfaction score: 8.5/10
- Voluntary turnover: 12% annually
- Time to full productivity: 6 weeks
Replacement Cost Calculation:
- Recruitment: $5,000
- Onboarding: $8,000
- Lost productivity during transition: $15,000
- Knowledge loss: Immeasurable
For a 8-person development team with high technical debt: Annual turnover cost: $78,400 (compared to $26,880 for clean codebases)
4. Client Relationship Impact
Technical debt directly affects client relationships in ways that are hard to quantify but impossible to ignore.
Timeline Credibility Loss: When technical debt slows down development, estimation becomes nearly impossible. I’ve seen teams go from 85% estimation accuracy to 40% accuracy as debt accumulated.
Example Client Conversation:
Client: "This seems like a simple feature. Why does it take 3 weeks?"
PM: "Well, our current architecture requires us to update multiple systems..."
Client: "But you built this system. Why didn't you build it right the first time?"
Measurable Impacts:
- 25% increase in change requests (due to delivered features not meeting expectations)
- 40% more time spent in client calls explaining delays
- 15% decrease in client satisfaction scores
- 2 client contracts not renewed due to delivery concerns
Identifying Technical Debt: The Project Manager’s Toolkit
As a PM, you might not write code, but you can definitely spot technical debt symptoms:
Warning Signs Checklist
🚩 Estimation Red Flags:
- “Simple” features consistently take 3x longer than estimated
- Developers provide wide estimation ranges (2-8 days instead of 3-4 days)
- Phrases like “it depends on how the existing system works”
🚩 Development Process Red Flags:
- Bugs in one area cause failures in seemingly unrelated areas
- Developers spend more time reading code than writing it
- Testing takes disproportionately long compared to development
- Deployments are complex and error-prone
🚩 Team Behavior Red Flags:
- Developers avoid working on certain parts of the system
- Knowledge is concentrated in one or two “legacy experts”
- Team pushes back on seemingly simple feature requests
- Frequent discussions about “rewriting from scratch”
Communicating Technical Debt to Stakeholders
The biggest challenge? Making technical debt visible and actionable for non-technical stakeholders.
The Business Language Translation
Instead of: “We have high coupling and low cohesion in our user management system.”
Say: “Adding new user features now takes 3x longer than it should because user logic is scattered across the entire application. This is costing us $15,000 per feature and delaying our roadmap by 2 months per quarter.”
ROI Arguments for Technical Debt Investment
The 20% Rule Business Case:
“Investing 20% of development time in technical debt reduction will:
- Reduce feature development time by 35% within 6 months
- Decrease bug reports by 50% within 3 months
- Improve developer retention by 60%
- Increase estimation accuracy from 45% to 80%
Net Effect: $120,000 annual savings for a $30,000 quarterly investment”
Practical Debt Management Strategies
Strategy 1: The Boy Scout Rule
“Always leave the code better than you found it.”
Implementation:
- Every feature development includes 10% time for minor cleanup
- Developers document debt they discover
- No feature is “done” until related debt is assessed
Strategy 2: Dedicated Debt Sprints
Quarterly debt reduction sprints focusing on high-impact items.
Sprint Structure:
Week 1: Debt identification and prioritization
Week 2: High-impact, low-effort debt items
Week 3: Medium-impact debt with business value
Week 4: Testing and documentation updates
Measurable Outcomes:
- 40% improvement in development velocity post-sprint
- 25% reduction in production bugs
- Improved team morale scores
Strategy 3: Architecture Decision Records (ADRs)
Document why debt-creating decisions were made.
Template:
# ADR-001: Hardcode Payment Gateway Integration

## Status: Accepted

## Context:
Client deadline: 2 weeks
Available development time: 3 weeks if we build properly
Business impact of delay: $50,000 lost revenue

## Decision:
Hardcode Stripe integration to meet deadline

## Consequences:
- Adding new payment methods will require 2x normal effort
- Testing becomes more complex
- Security updates require manual code changes

## Debt Repayment Plan:
- Refactor to payment abstraction layer in Q3
- Estimated effort: 1 week
- Business value: Enable faster payment method additions
Strategy 4: Debt-Aware Estimation
Include debt impact in all project estimates.
Estimation Framework:
Base Feature Estimate: X days
+ Debt Tax (current system complexity): 25% of X
+ Integration Complexity: Y days
+ Testing in Legacy Environment: Z days
= Total Realistic Estimate
Long-term Debt Prevention
Architecture Review Process
Monthly architecture reviews focusing on:
- Coupling and cohesion metrics
- Code complexity trends
- Test coverage gaps
- Performance bottlenecks
Developer Education
Quarterly workshops covering:
- SOLID principles in practice
- Refactoring techniques
- Testing strategies
- Clean code practices
Client Education
Setting proper expectations:
- Explain the technical debt concept using business analogies
- Include debt management in project proposals
- Make technical health a visible project metric
The Bottom Line
Technical debt isn’t a technical problem—it’s a business problem disguised as a technical one. As project managers, we have the responsibility to make this invisible cost visible and actionable.
The companies that thrive long-term are those that treat code quality as a first-class business concern. The ones that struggle are those that think they can “code fast now, fix later.”
The math is simple: Pay 20% interest now, or pay 280% compound interest later.
The choice is yours.